Mem0 Memory Observability
Mem0 · 2025-2026
Mem0 is the memory layer for AI agents. I designed and built the whole platform dashboard end to end, from a developer's first API call to inspecting why a single memory was retrieved in production. Two parts did the heavy lifting: the onboarding that got developers to their first memory, and the Request Inspector that made memory legible once they were in.
A memory layer has a cold-start problem twice over. A developer has to get from a signup to a first working memory call before they believe in it, and then they have to understand what it is doing before they trust it in production. The dashboard had to answer both, so I treated onboarding and observability as the two beats that mattered and let everything else stay quiet around them.
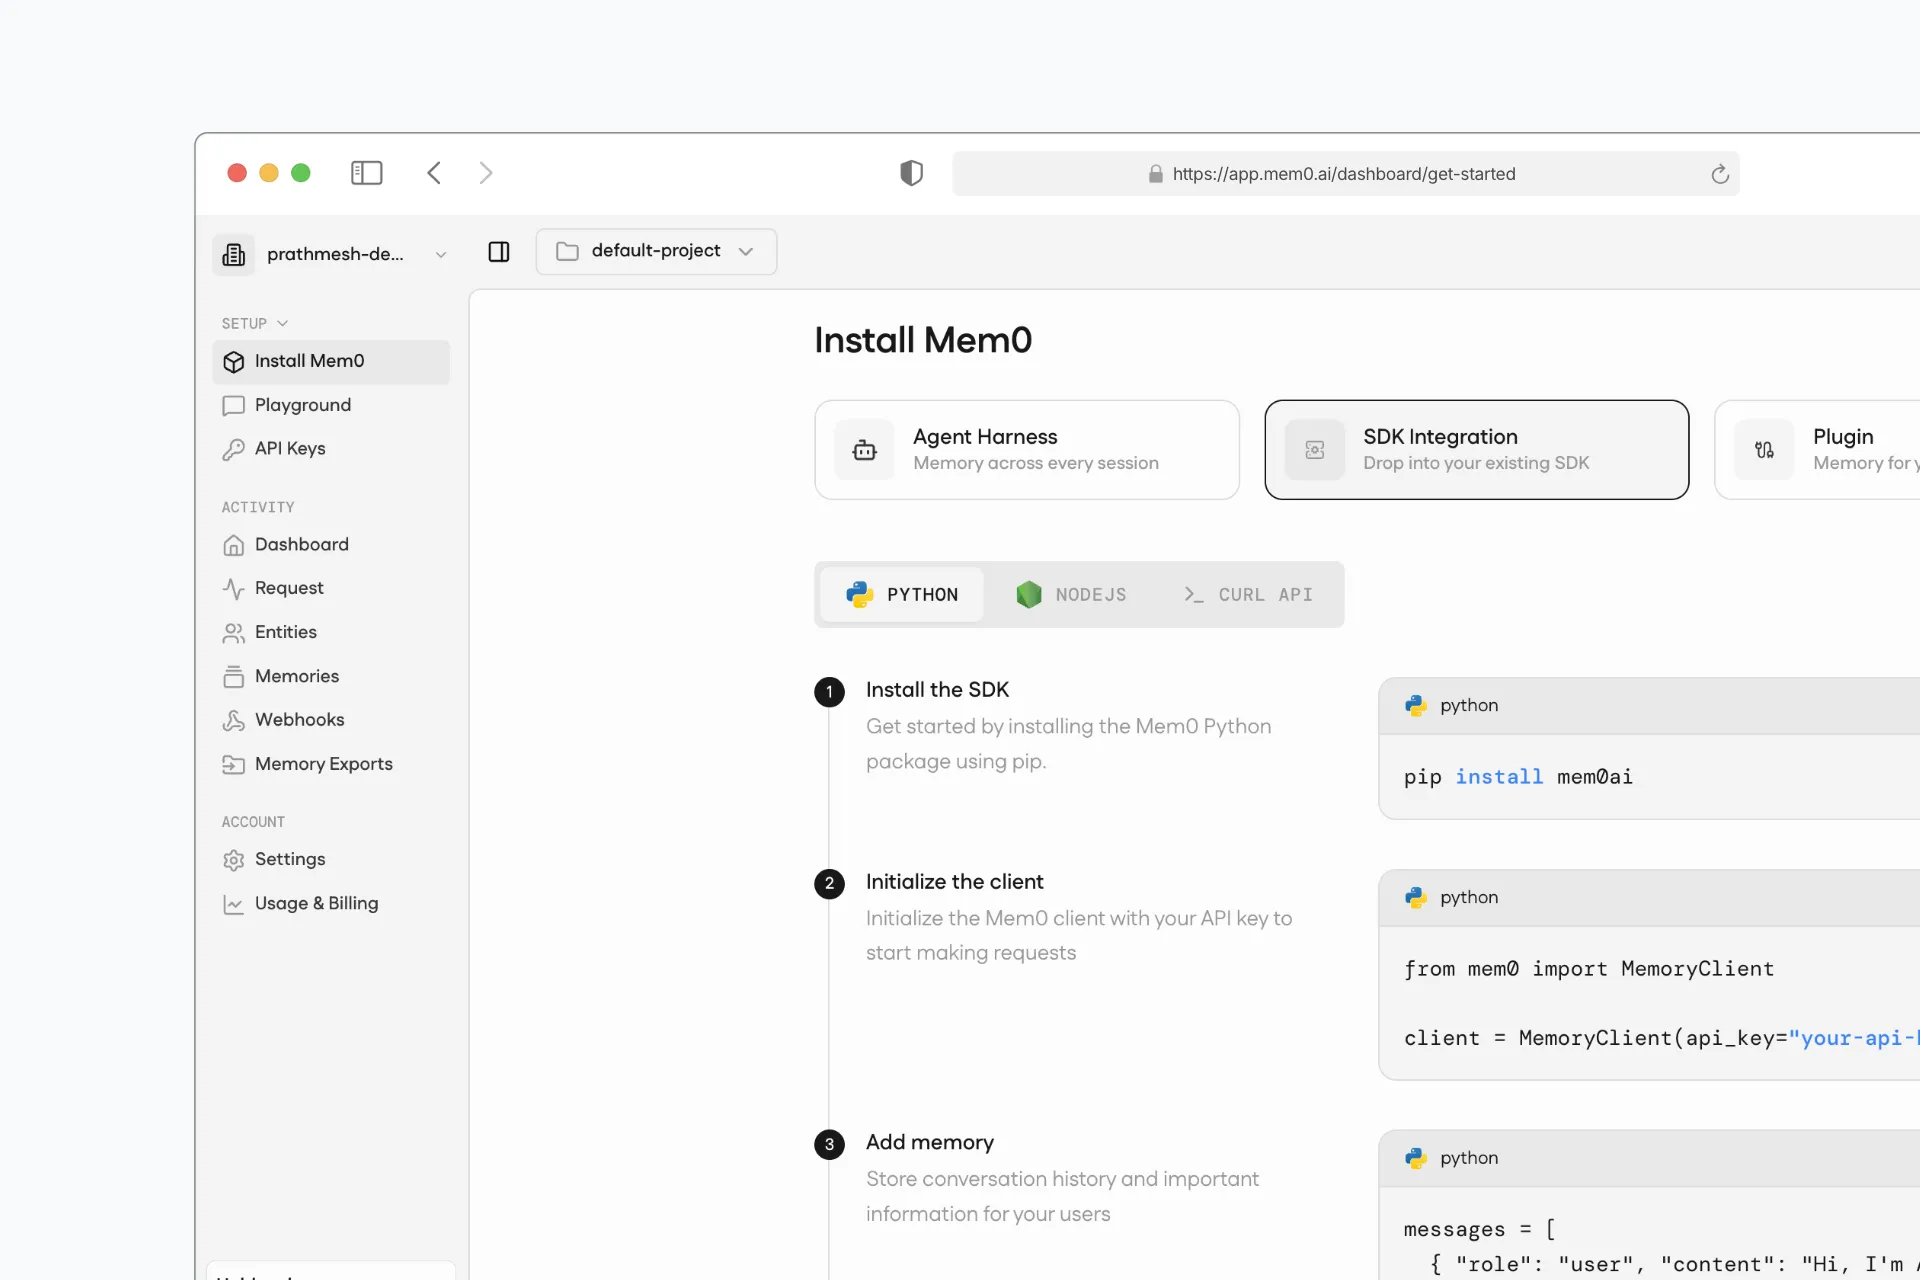
Onboarding was an activation problem, not a tour. The job was to get a new developer from signup to a working integration as fast as possible, because the moment that proves the product is the first real memory. I rebuilt the first-run path around that single moment: the fastest route to a first successful call, with the friction taken out of the steps in between. Activation, measured as developers making more than 10 API calls, went from roughly 6–7 percent to over 40 percent, the clearest signal the onboarding was doing its job.
The Request Inspector was a legibility problem with no prior art. A developer opens it to answer one question: why did my agent get this memory back for that request? Logs and traces exist everywhere, but none are built for memory, because a memory is not a row or a span, it is something a model chose to keep from a conversation. The first versions showed everything, and raw completeness reads as noise. So the work was subtraction. I stripped the fluff, gave the view a hierarchy a developer reads top-down like a stack trace, and built it around one idea: show the chat, and from that chat, which memories got added. Provenance, not just output. That link is what turns "the system returned this" into "I see why."
Around those two beats sits the operational surface developers live in. Usage and billing make cost, limits, and consumption readable at a glance. Request Logs is the high-level stream you scan to catch anything off, and the entry point into the Inspector. Memories Details and Memory Intelligence go a layer deeper into the store itself. The Playground lets a developer test a query against their own memory without writing a line of code. Each is a full view in its own right, designed to the same bar, and together they make the dashboard something you can run a production system on.